
6
Clean Water and Sanitation
Water is an essential natural resource for the survival of all forms of life. Individual and collective responsibility in the conscious use of water is crucial to ensure availability for future generations. Grupo K1 works to minimize water consumption and wastewater generation in its processes.
Water consumption and wastewater reuse in 2024 (Headquarters)
| Total water consumption | 35.720.440,00 |
|---|---|
| Industrial process water consumption | 17.772.110,00 |
| % of water used in industrial processes | 49,75 % |
| Total wastewater generated (industrial + sanitary) | 20.665.700,00 |
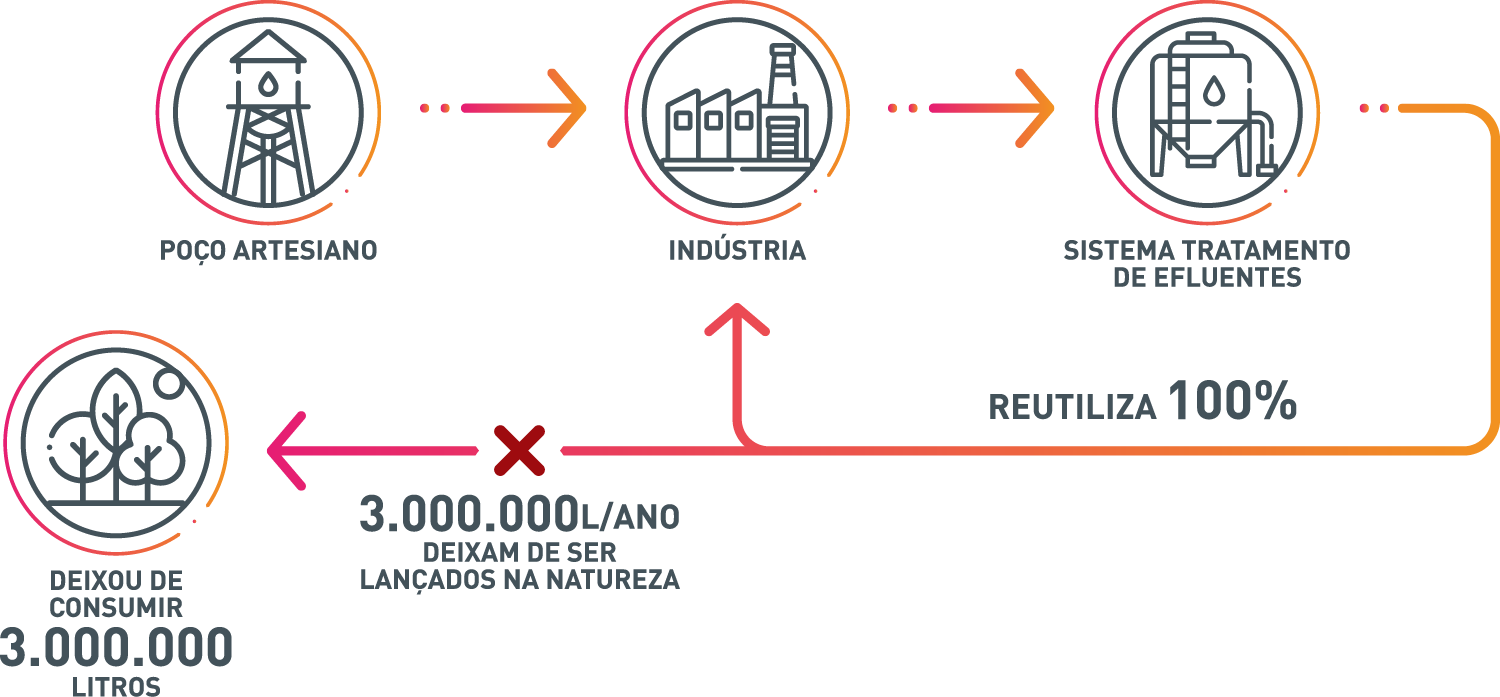
| Reused industrial wastewater | 3.306.370,00 |
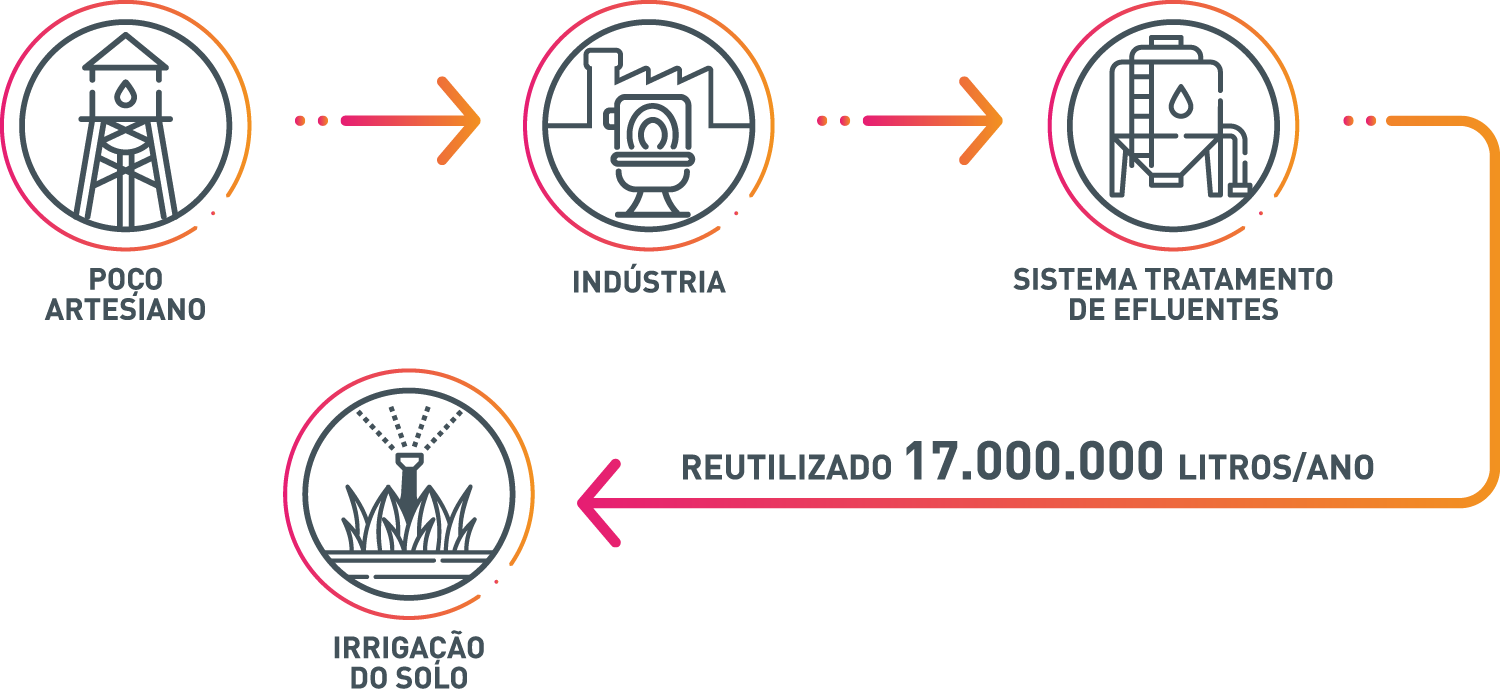
| Efluente sanitário reutilizado | 17.359.330,00 |
| Reused sanitary wastewater | 100 % |
Efluente Sanitário
Efluente Industrial
Industrial wastewater generation overview (Headquarters)
| 2025 | 2024 | 2023 | |
|---|---|---|---|
| General average of effluent generation in the industrial process (L) per dm² of product produced | 0,134 | 0,148 | |
| Percentage reduction compared to the previous year | -9,37% | ||
| Target for reducing effluent generation in the, industrial process in (L) per dm² of product produced in relation to the previous year | -4,00% | 0,00% | 0,00% |
At the Headquarters, wastewater generation is measured relative to the product’s surface area to provide greater clarity in water management. Efforts to reduce wastewater in the industrial process resulted in a 9.37% reduction in 2024 compared to 2023.


